In the previous article of this series, I provided a detailed overview of joins and their essential nature in SQL. Together, we reviewed the importance of mastering CTEs and LEFT JOINs. Based on my experience in the industry, these two concepts cover the vast majority of use cases.
In reality, the time spent writing SQL queries is relatively small compared to the time spent understanding the data environment, the business challenges, the quality of the data, as well as the actual needs of the teams, etc.
However, sometimes it will be necessary to step up a level to perform more in-depth analyses. This involves using SQL's analytical functions (or window functions).
Window functions allow for the execution of complex calculations while maintaining a global context across the entire dataset. They are particularly useful for tasks such as calculating moving averages, cumulative totals, rankings, or comparing values between adjacent rows.
Anatomy of a window function
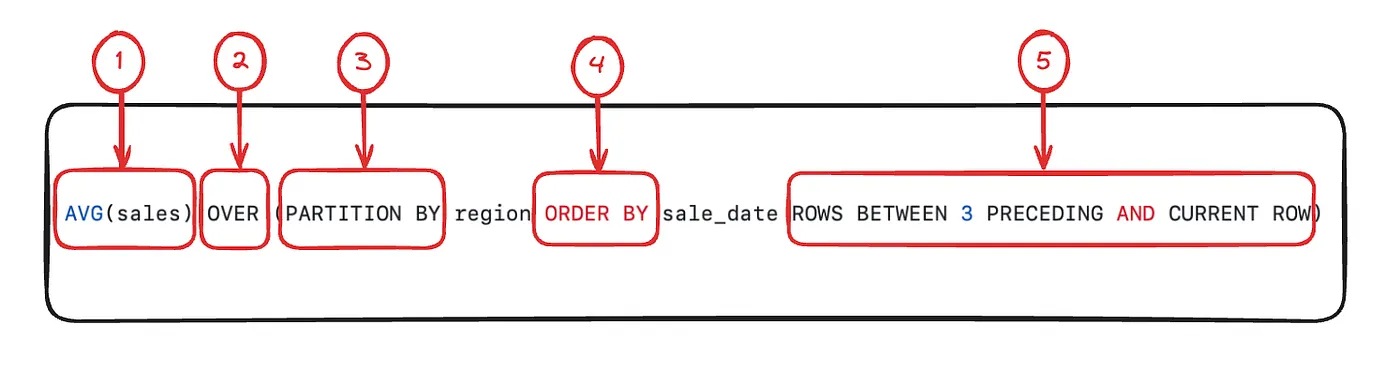
A window function generally consists of several key components, allowing it to apply to a specific set of rows while providing detailed results for each row within that set. Here are the main components of a window function:
1. The Analytical Function
This is the core of the window function. It defines the operation to be performed on a set of rows. Common examples include SUM(), AVG(), RANK(), ROW_NUMBER(), LAG(), LEAD(), etc. These functions can be used to calculate sums, averages, ranks, or even access the values of another row within the window.
2. The OVER Keyword
This keyword is essential to transform a regular function into an analytical function. It defines the context in which the function will operate, i.e., the set of rows to be considered.
3. The PARTITION BY Clause (Optional)
The PARTITION BY clause divides the data into subsets (or partitions), on which the function will be applied independently. For example, if you want to calculate a rank by department within a company, the partition would be done by department.
4. The ORDER BY Clause (Optional)
This clause specifies the order in which the rows within each partition will be analyzed. The order is crucial for certain functions like RANK(), ROW_NUMBER(), or even LAG() and LEAD(), as the calculation depends on the position of rows relative to each other.
5. The Window Frame (ROWS or RANGE) (Optional)
The window frame clause restricts the rows that will be considered in the function’s calculation. You can, for instance, limit the function to include only the three previous rows or rows within a specific interval. Common options include:
-ROWS BETWEEN UNBOUNDED PRECEDING AND CURRENT ROW: All rows from the start of the partition up to the current row.
-ROWS BETWEEN 3 PRECEDING AND 1 FOLLOWING: Three preceding rows, the current row, and the next row.
-RANGE BETWEEN INTERVAL '30' DAY PRECEDING AND CURRENT ROW: Limits the calculation to the 30 days preceding the current row.
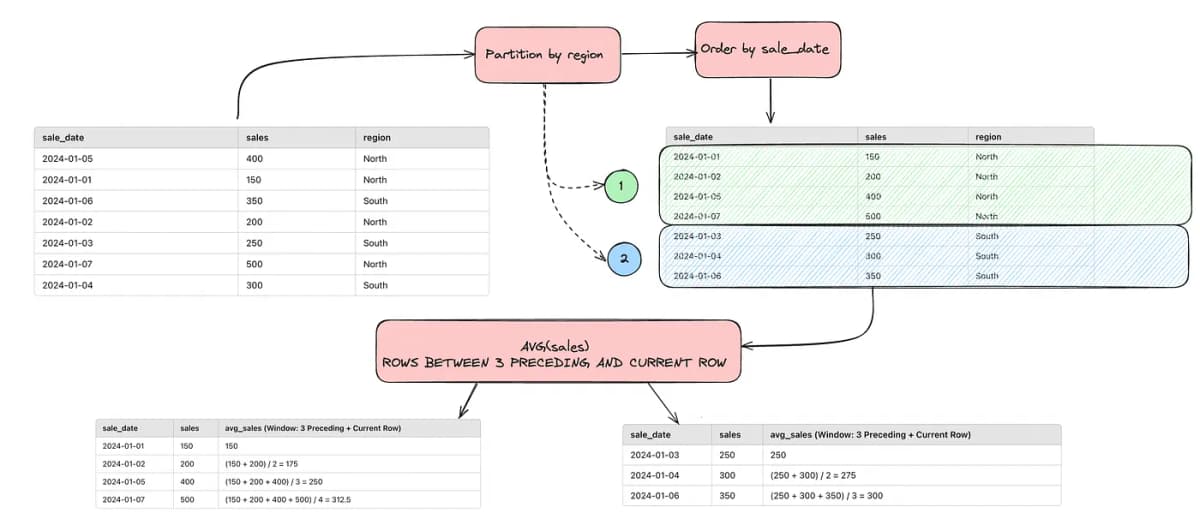
Example:
AVG(sales) OVER (
    PARTITION BY region
    ORDER BY sale_date
    ROWS BETWEEN 3 PRECEDING AND CURRENT ROW
)
In this example, the function AVG(sales) OVER (PARTITION BY region ORDER BY sale_date ROWS BETWEEN 3 PRECEDING AND CURRENT ROW) calculates the average of sales over the previous three rows as well as the current row, for each region, while respecting the chronological order of the sale dates.
Here’s an illustration of what actually happens:
Thus, a window function combines the flexibility of being able to partition, order, and define a specific calculation frame for each row in a dataset. This makes it a powerful tool for time series analysis, comparative analysis, or performance studies.
In the upcoming sections, we will examine practical examples to illustrate each component of this structure, as well as real-world use cases in business settings.
Let’s continue with some practical examples based on a synthetic marketing dataset, illustrating the use of different window functions with analyses relevant to a business.
Base Dataset
The dataset we’re using contains the following columns:
-campaign_date: The date of the marketing campaign.
-marketing_channel: The marketing channel used (Email, Social Media, SEO, etc.).
-region: The region targeted by the campaign (North America, Europe, Asia, etc.).
-spend_usd: The amount spent on the campaign (in dollars).
-conversions: The number of conversions generated by the campaign.
Analytical Calculations Using Window Functions
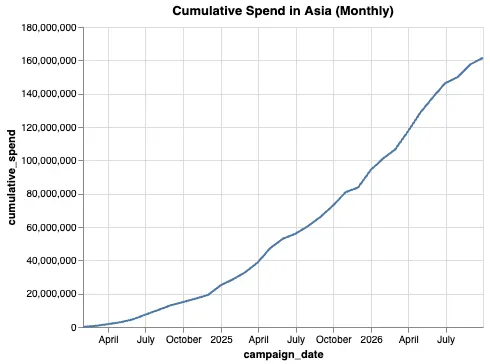
Tracking Cumulative Spend by Region
To analyze the performance of spending by region, we can use the SUM() OVER function to calculate the cumulative spend over time in each region.
Here’s an example of how this can be done:
SELECT
    region,
    campaign_date,
    spend_usd,
    SUM(spend_usd) OVER (PARTITION BY region ORDER BY campaign_date) AS cumulative_spend
FROM marketing_data
ORDER BY region, campaign_date;
This query allows us to see how spending evolves in each region over the course of various campaigns. It helps identify whether a region is receiving more investment over time or if the budgets are being distributed more evenly.
Query to identify the top 5 best campaigns in terms of conversions:
To identify the 5 best campaigns based on the number of conversions generated, you can use an SQL query that ranks the campaigns by the number of conversions using the RANK() or ROW_NUMBER() function with a partition based on marketing channels or regions (depending on your needs). Here’s an SQL query that retrieves the 5 campaigns with the most conversions:
WITH ranked_campaigns AS (
    SELECT
        campaign_date,
        marketing_channel,
        region,
        conversions,
        RANK() OVER (ORDER BY conversions DESC) AS rank_conversion
    FROM marketing_data
)
SELECT
    campaign_date,
    marketing_channel,
    region,
    conversions
FROM ranked_campaigns
WHERE rank_conversion <= 5
ORDER BY conversions DESC;
Query to identify the top 5 best campaigns by region:
To identify the 5 best campaigns per region in terms of conversions generated, you can use the RANK() or ROW_NUMBER()function partitioned by region. This allows the campaigns to be ranked within each region, and the top 5 in each partition can be filtered. Here is the SQL query to achieve this result:
WITH ranked_campaigns AS (
    SELECT
        region,
        campaign_date,
        marketing_channel,
        conversions,
        RANK() OVER (PARTITION BY region ORDER BY conversions DESC) AS rank_conversion
    FROM marketing_data
)
SELECT
    region,
    campaign_date,
    marketing_channel,
    conversions
FROM ranked_campaigns
WHERE rank_conversion <= 5
ORDER BY region, rank_conversion;
As you can see, window functions are very useful for performing advanced calculations. In my experience, they won’t make up the majority of queries you’ll need to write, but certain cases will require the use of these features. Mastering window functions is often a great way to stand out and perform advanced analyses that a typical business analyst or data analyst might not even consider.
Being proficient with these functions can enable you to unlock deeper insights and provide more value to your organization through sophisticated data analysis.